
NASA Space Apps 2020

Four in the morning, a fan running at its maximum capacity yet a room so hot one can probably boil an egg (Note: exaggeration). Two laptops opened in front of me, one of them on the verge of crashing. Coldwater could only help my eyes so much -- red, painful, and begging me for sleep -- but I was more focused than ever. It felt like 48-hour long bursts of interval sessions in cycling -- hard but worth it.
Due to COVID-19, NASA organized a "special event" to work on understanding the coronavirus and its effects around the world using Earth Observation Data (EO Data). Now I have never fiddled around with EO data but I am a pretty good coder so I was 69 percent confident about being able to contribute well to a team project. But boy did I go through some madness during those 2 days. So let's get started.
Note: this is only my part of the project. I cannot imagine how long this already long post would be if I wrote about every teammate's part. Read about the whole project very here.
May 29th
The Chatroom
I expected a lot of things to go wrong but not a chatroom -- I could not connect to my country's server for a day due to some error. It was probably foreshadowing my life for the next 48 hours. By the time I got access, it looked like everybody had gotten their choice of teams. But it did not matter, no Nepalese teams were working on the topic :

It is a very open-ended topic --- one can really come up with their problem statement and still get away with it. I assume most teams were turned off by the lack of applicability of this topic which pushed them towards more engineering-based topics.
I had left a message on the message board about my interest in that topic along with my skills. Luckily, a team reached out to me. It was an international team -- a team consisting of people from several countries -- asking me to join them. What perfect timing! They looked like they knew what they wanted to do. So yeah, I joined Team IMPACT!
A team of 4 members -- two from India, one from Nepal, and Pakistan.
https://twitter.com/pawanrants/status/1266667719958683650/photo/1
You can check out our final project and read it in more detail here.
MAY 30th
Throw stuff at the wall until something works.
We decided that we would work with EO data collected from India. I know our countries had their differences at that time but this is called a Hackathon where people see ideas rather than nationality. Furthermore, it was logical as to why India was a perfect choice -- big area, more data, more analysis, more prediction, better and stronger project. Every one was sold.
The day before, we were not sure how we wanted to approach this topic so we all decided to look into a few datasets released by NASA, ESA, and JAXA and come up with some ideas. I, being the noob here, did nothing and kept working on a stupid parsing library. In the morning, two of my teammates brought up the idea about analyzing CO, NOx data, and Night Light data -- pretty cool stuff. I decided to look into the transportation aspect of it.

Vehicle Restriction due to the lockdown causes the transportation rate to go down drastically. It has a direct impact on the socio-economic aspect of any country in general. The only problem is to find out by how much with the help of EO data. There are statistical datasets available but we only use them to check the deviations from the output of EO data analysis. I checked a lot of resources provided to us. After a few hours, I found some algorithms capable of masking and detecting vehicles. Then I used the Sentinel Playground to mess with their parameters before applying it to the datasets from April to May for 2019 and 2020.

Murphy's Law: Anything that can go wrong will go wrong.
While researching algorithms and downloading datasets was not that hard, the coding part was the messiest. I had to deal with issues that I did not even think existed before.

Problem 1 -- Anaconda
The Sentinel Playground API needed a specific library to send and authenticate the credentials. However, that library had to be installed using a tool called "Anaconda" which I did not have in my system. So I started the installation for Anaconda and went cycling. The horror of seeing the installation stuck at 98% for an hour was just petrifying. I tried to reinstall it again -- a stupid idea, it ended up costing me an extra half an hour. Luckily my dad's laptop saved the day. The issue was probably with my outdated windows whose updating feature I had disabled to speed up my browsing speed -- who knew the past would come back to bite me.
Problem 2 -- Chrome
To use the credentials, I needed to create one from the platform. But the problem is -- I could not access the platform through my browser. For hours, I thought it was due to some database errors but when I opened up the Firefox browser and tried to log in -- it worked. Smiling at a successful website load is rare in a world plagued by apps with psychological feedback loops.
Getting the code to run was itself a problem but the first time I ran the code, the screen froze after 10 sec. I was using the same area boundary box values as used while testing the algorithm. It turned out the area was too big for the data processing tool to handle using a puny laptop's processing power.
May 31st
It runs in the background whether we know it or not, executing its tasks silently -- daemons -- we call them. Reminding us of the dread we are trying to run away from.
Here we are, at four in the morning. I was feeling a little sleepy; but I kept trying to fix the bugs in my code, moving the data through a thumb drive from one laptop to another and vice versa. It was cumbersome but I felt like it was going to work. I was pushing my computer to its limit and it finally produced the first vectorized image -- not gonna lie, my backbone had the biggest relief as I pushed back into my chair and looked at it in awe. The vehicles highlighted, lands darkened, roads visible, it all looked perfect.
I tested the program with boundary data from a few cities in France -- some work was needed but it was okay. So, I went to bed for 4 hours.
The daemons reminding me of the deadline.
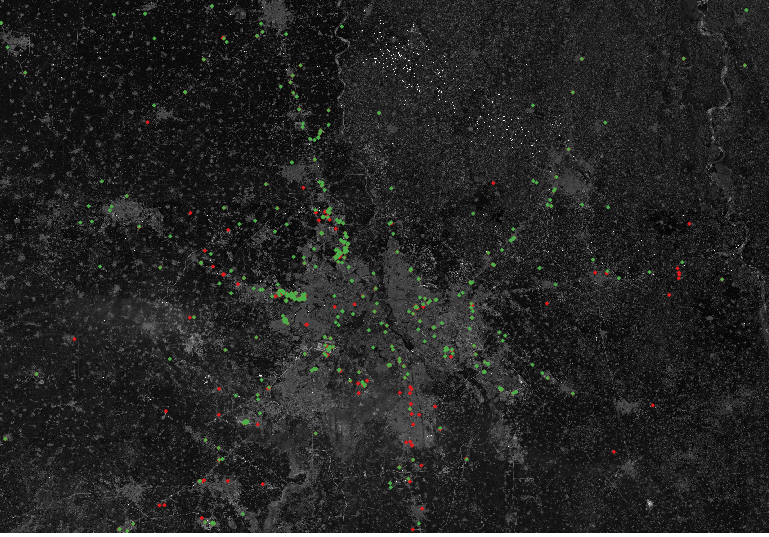
Throughout the day, I experienced a lot of crashing and re-attempts but by the evening, I had gathered almost 20 data images but unfortunately, only about 8 were visually intriguing. So, I calculated the drop rate of vehicle -- it turned out to be about 30% to 50% -- the discrepancy is high but that is what one gets when one uses 20 images to calculate the drop rate.
Made the images look "scientific" with 2019 and 2020 images overlayed on top of each other and separated the vehicles with different colors. I mean it still looks pretty cool to me.


By 10 P.M, most of us were done with our analysis and were ready to merge but we still had to find one single big idea that encapsulated what all our compartmentalized narratives were chasing. We all hopped on a call with one of the mentors who was impressed by our work and told us that we just needed to work super hard in our presentation because it could either make or break our narrative. Honestly, it felt good to hear that little bit of appreciation for the work all of us did in those two days.

We spent the entire night working on a description, presentation, and video. I worked on creating a GitHub repo where we uploaded all our code and the description. One of the teammates worked on a future app proposal which was super cool -- it seamlessly integrated all our ideas into a governmental application for the Indian Government.
The official NASA International Space Apps Challenge team mentioned our project on Twitter. It cannot get any cooler than that!
The night went by but we were still not done with the presentation. A 30-second video was yet to be made. One of the teammates had made one but it had no narration -- I did not understand much from it. So, I raised the concern to voiceover our work in it. But I guess everyone was sleep-deprived and were not willing to do it and of course, our project was already strong. So, we submitted our project around 7 am and everyone went to sleep. Woke up after 6 hours and went cycling. What a way to remove all the stress!

All the sleepless nights and constant barrage of problems throughout the day were all worth it. These past 2 years have been pretty significant years of my life as I have learned to deal with failures and accept them as a learning opportunity than just mere setbacks. I now understand what it is like to have a team of passionate and hardworking people and what sets a good team apart from a mediocre one. A single person in a hackathon would be crushed by the immensity of the work required to be done.
Furthermore, coming from a completely programming background, it was pretty confusing and daunting to figure out what resources to utilize. When one does not know how to navigate through such problems -- despair can kick in quite quickly. The ability to tinker is really important -- ultimately, I managed to learn a lot of Earth Observation data analysis and manipulation tools just by messing around with them on the first day. This is the way how I have been learning since my childhood and everyone should actively seek answers by tinkering rather than being spoon-fed. Learning by breaking down something to its fundamental level has a greater value than being taught by someone else.
And we made it to Global Finalists -- Top 40 out of 1500 teams. What a happy ending!
